
Most Australian importers choose their shipping route the first time, usually by accepting whatever service their first freight forwarder offers, and revisit it only when something goes wrong. A missed shipment, an unexpectedly long transit time, or a rate spike on their usual lane forces a comparison they should have done at the start.
Route choices are not one-size-fits-all: the right route from Guangdong Province to Melbourne is different from the right route from Ho Chi Minh City to Perth, and both are different from the route evaluation for goods from Milan to Brisbane.
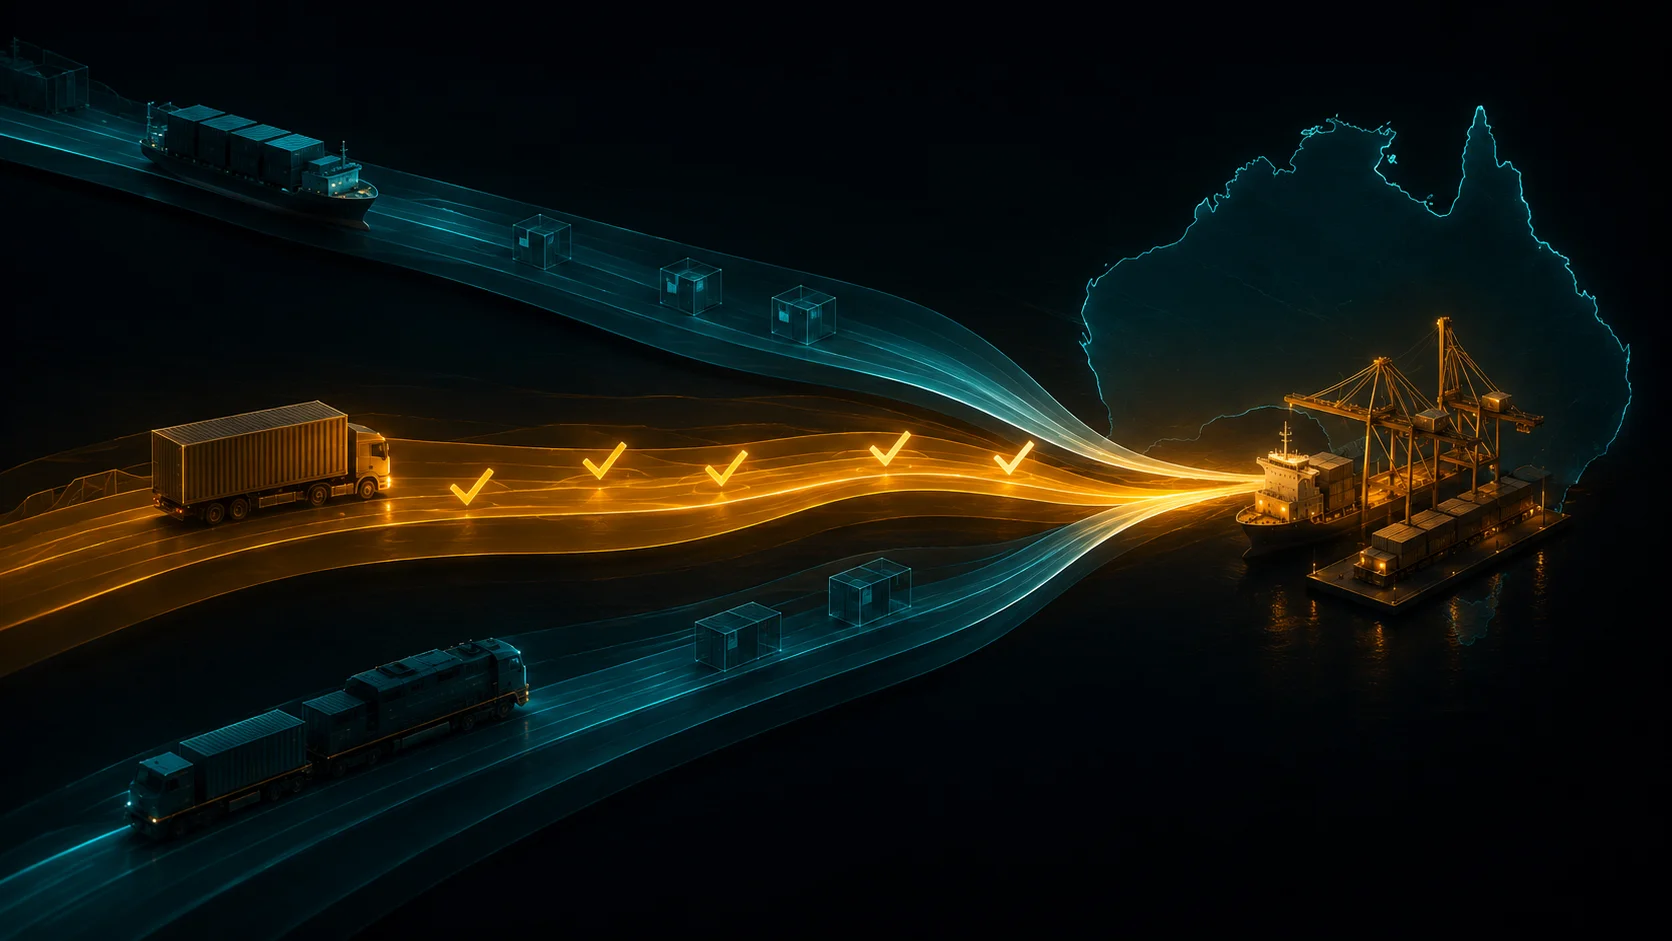
Australia’s Import Port Landscape
Container throughput figures below are annual TEU volumes; the ACCC’s Container Stevedoring Monitoring Report publishes updated port-by-port volumes each year.
Port Botany (Sydney): Australia’s second-largest container port, handling approximately 2.5 million TEUs per year. Port Botany is the most competitive import port for freight rates on most Asia-Australia lanes because of the high service frequency and carrier competition. Most major shipping line alliances call Sydney directly from all major Asian origins. For importers whose warehouse is in Sydney or who distribute to NSW and ACT, Port Botany is typically the default choice and is rarely worth departing from on cost grounds.
Port of Melbourne (Webb Dock and Swanston Dock): Australia’s largest container port, handling approximately 3.1 million TEUs per year. Melbourne has strong direct services from China, Vietnam, and increasingly India. For Victorian businesses and those distributing nationally via Melbourne, this is the natural destination port. Freight rates to Melbourne are generally comparable to Sydney; for some origin ports, Melbourne is slightly cheaper, and for others slightly more expensive. The differential is typically AUD 100–250 per TEU on major Asia lanes.
Port of Brisbane: Queensland’s main container port, handling approximately 1.1 million TEUs annually. Brisbane has direct services from major Chinese ports and Southeast Asia, though with fewer service options than Sydney or Melbourne. Frequency is slightly lower, because not all carrier services that call Sydney and Melbourne also call Brisbane. For Queensland-based importers or those serving the northeast of the country, Brisbane avoids the cost and transit time of trucking from southern ports. Freight rates to Brisbane are typically AUD 100–300 per TEU above Sydney rates on equivalent lanes due to lower competition and slightly longer vessel voyage times.
Fremantle (Perth): The dominant port for Western Australia, handling approximately 850,000 TEUs. Fremantle has direct services from Southeast Asia, China, and the Indian subcontinent, and is a key port for the mining and resources sector. Freight rates to Fremantle can be AUD 200–500 per TEU above east coast rates on some lanes because of lower service competition; on others (particularly routes originating in South and Southeast Asia), Fremantle rates are competitive. For businesses distributing in WA, SA, and the Northern Territory, Fremantle is the operational choice regardless of the rate differential.
Port Osborne (Adelaide): South Australia’s container port, approximately 400,000 TEUs. Adelaide typically has fewer direct services and lower frequency than east coast ports. LCL importers are often better served routing via Melbourne with onward road transport to Adelaide (approximately 730 km, 7–8 hours truck time) rather than waiting for less frequent direct Adelaide services. For FCL importers with sufficient volume, direct Adelaide services do exist on major Asia lanes and are worth quoting.
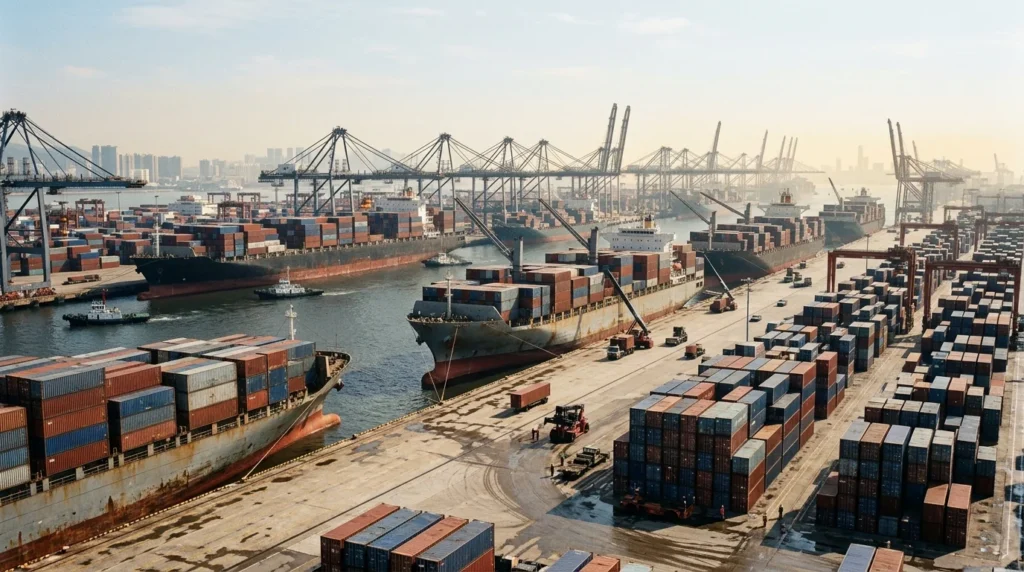
China to Australia: The Dominant Lane
China-to-Australia is the most important import lane for most Australian businesses, accounting for roughly a quarter of Australia’s total merchandise imports by value (DFAT trade statistics). The lane has mature service infrastructure with strong carrier competition and multiple routing options.
South China origins (Yantian, Nansha, Shekou): The Pearl River Delta manufacturing region of Guangdong Province ships through Yantian (Shenzhen) and Nansha (Guangzhou). These are the busiest export ports on the China-Australia lane. Direct services to Sydney and Melbourne run 14–18 days; Brisbane 16–20 days; Fremantle 17–21 days. Most major carrier alliances offer weekly departures from Yantian. This is the most competitive origin for rate purposes, with the highest frequency of direct services.
East China origins (Shanghai, Ningbo): Yangtze River Delta manufacturing in Zhejiang and Jiangsu ships through Shanghai and Ningbo. Transit times to Sydney are 14–17 days direct; slightly shorter than Yantian on some services due to more northerly routing. Ningbo is particularly important for apparel, textiles, and consumer goods; Shanghai for machinery, automotive parts, and electronics.
North China origins (Tianjin, Qingdao): Northern manufacturing for industrial goods, machinery, and chemicals. Transit times to Sydney are 16–22 days direct. Fewer direct services than south or east China; some cargo routes through Qingdao or Shanghai transshipment before the Australia leg, adding 3–7 days.
Transshipment versus direct: The choice between direct service and transshipment via Singapore or Port Klang is principally a trade-off between transit time and cost. Direct services are generally preferred for most cargo because they are faster, involve one less handling event (reducing damage risk), and have better schedule reliability, because the container does not depend on a transshipment connection that can be missed. Transshipment via Singapore or Port Klang can occasionally offer lower rates on specific port pairs, and may be the only option for less-served origins (regional Chinese ports without direct Australia services). For standard cargo under normal market conditions, direct services are preferred when available at comparable rates.
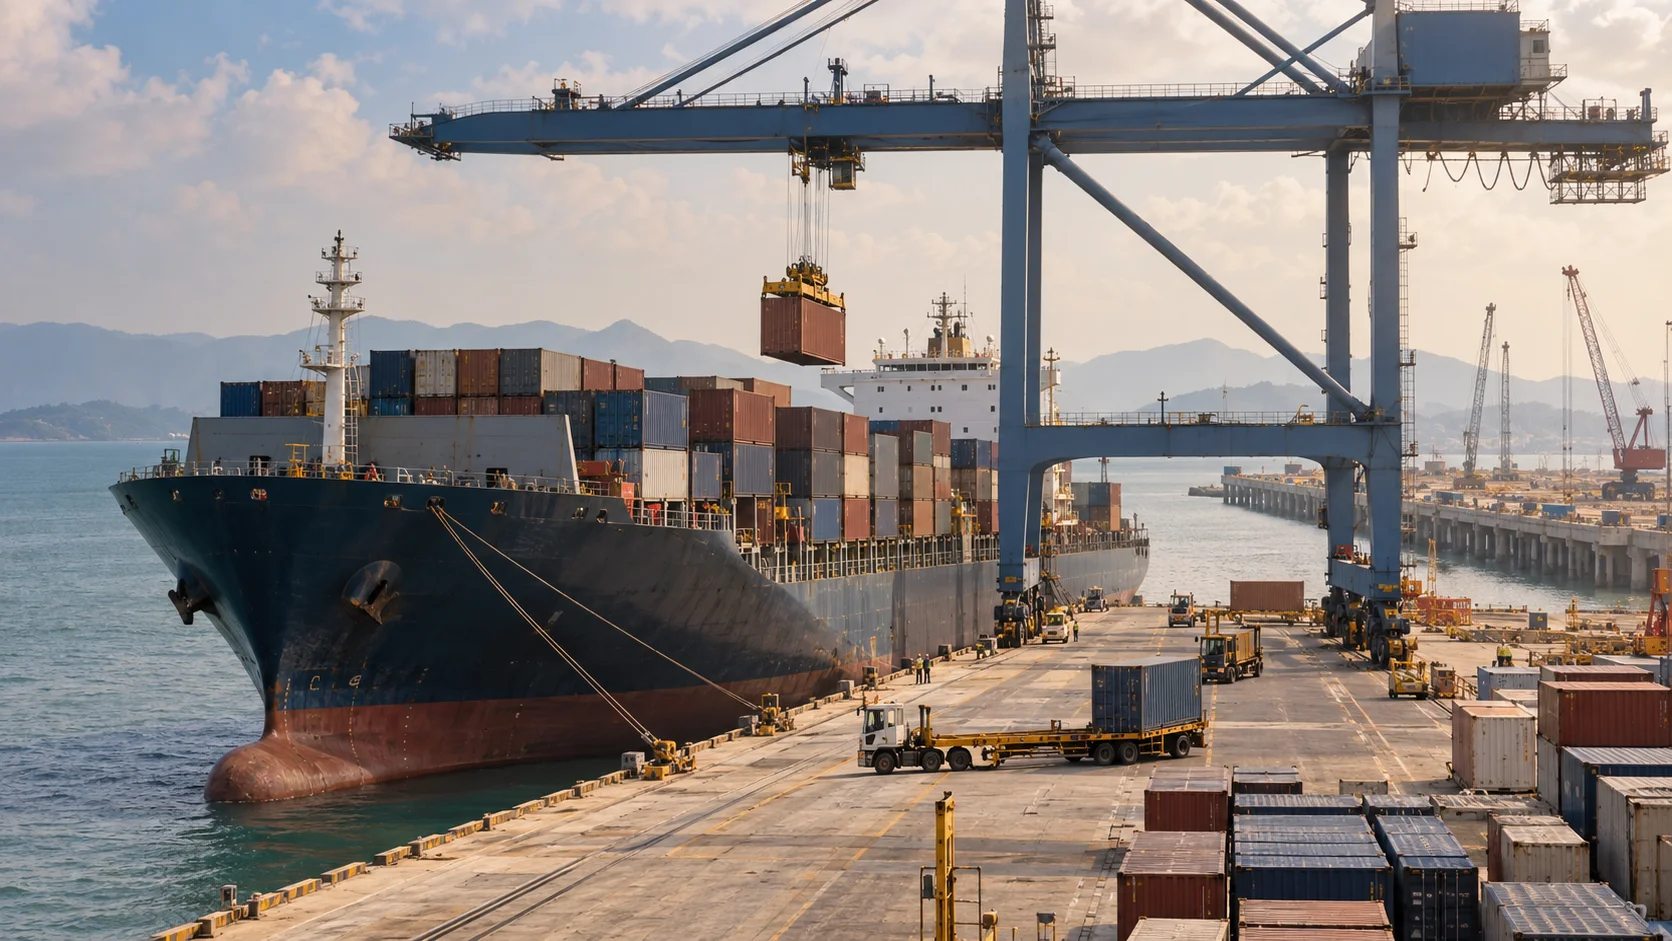
Southeast Asia to Australia
Vietnam, Thailand, Indonesia, Malaysia, and the Philippines are increasingly important origin markets for Australian importers, particularly for apparel, footwear, electronics assembly, furniture, and food products.
Vietnam (Ho Chi Minh City / Cai Mep, Hanoi / Hai Phong): Vietnam’s export infrastructure has developed rapidly over the past decade. Cai Mep-Thi Vai deep-water terminal (serving Ho Chi Minh City) now handles large container vessels directly; Hai Phong handles northern Vietnam exports. Direct services from Ho Chi Minh City to Sydney and Melbourne run 14–20 days; services from Hai Phong are typically longer (18–25 days) or route via Singapore. Vietnam-to-Australia freight rates on direct services are generally comparable to or slightly below equivalent China-Australia rates. ASEAN-Australia-New Zealand Free Trade Agreement (AANZFTA) concessions apply to Vietnamese-origin goods meeting rules of origin. Confirm with your broker whether your specific products qualify before relying on AANZFTA rates.
Thailand (Laem Chabang): Laem Chabang is Thailand’s major deep-water export port. Services to Australia run primarily via Singapore or Port Klang transshipment, adding 7–14 days to the base transit. Direct services from Laem Chabang to Australia are limited. Most Thailand-origin cargo transships at Singapore onto Asia-Australia mainline services. Total transit time Sydney 18–27 days; Melbourne similar. Thailand-origin goods can qualify for AANZFTA concessions, particularly important for automotive parts, electrical goods, and processed food.
Indonesia (Tanjung Priok / Jakarta, Surabaya): Indonesia exports to Australia primarily through Tanjung Priok. Services to Sydney and Melbourne are either direct (some services, 12–16 days from Jakarta) or via Singapore (adds 5–10 days). Indonesia-to-Australia is an important lane for furniture, textiles, agricultural goods, and seafood. AANZFTA rates apply to Indonesian-origin goods meeting rules of origin. Fremantle services from Indonesia are particularly competitive for WA-based importers of Indonesian goods.
Malaysia (Port Klang, Penang): Malaysia is itself a transshipment hub as well as an export origin. Port Klang is a major hub for Singapore-routing vessels. Direct Malaysia-to-Australia services are available from Port Klang, with transit times of 10–15 days to Sydney, among the shorter transit times from Southeast Asia due to geographic proximity. Malaysia exports electronics, rubber goods, palm oil products, and manufactured goods.
Europe to Australia: The Cape of Good Hope Adjustment
The Europe-Australia lane underwent a structural change from late 2023 onwards as the Red Sea security situation forced carriers to reroute vessels via the Cape of Good Hope rather than Suez Canal. The practical consequences for Australian importers sourcing from Italy, Germany, Spain, France, Portugal, and the UK:
Transit time increase: Cape of Good Hope routing adds approximately 10–14 days versus the Suez route. Pre-disruption transit times of 28–35 days from major European ports to Sydney are now 40–50 days on most services. A limited return to Suez began in early 2026, led by CMA CGM, but it is a test rather than a recovery: Xeneta counted 120 Suez transits in November 2025 against 583 in October 2023. Plan on Cape routing until your carrier confirms in writing that your specific service has switched.
Capacity reduction: Longer voyages mean the same vessel fleet provides less capacity per time period. Australia-Europe carriers have responded with general rate increases and reduced service frequency on some strings. The result is a thinner service menu than pre-2024 and higher average rates.
Lead time planning adjustment: Australian importers sourcing from Europe must now plan a minimum of 8–12 weeks from purchase order to goods arriving in Australian warehouse (5–7 weeks production, 6–7 weeks transit and clearance). This is 2–3 weeks longer than pre-2024 standard lead times. Safety stock and reorder points must be recalculated to reflect the longer and more variable supply chain.
Origin ports: Major departure points for Europe-Australia services include Rotterdam, Hamburg, Antwerp, Le Havre, Genoa, and Barcelona. Not all European ports are called on every service rotation. Goods from suppliers in Spain or Portugal may route through Rotterdam or Hamburg before the Australian leg, adding 3–7 days. Confirm your supplier’s nearest called port when evaluating the full transit time.
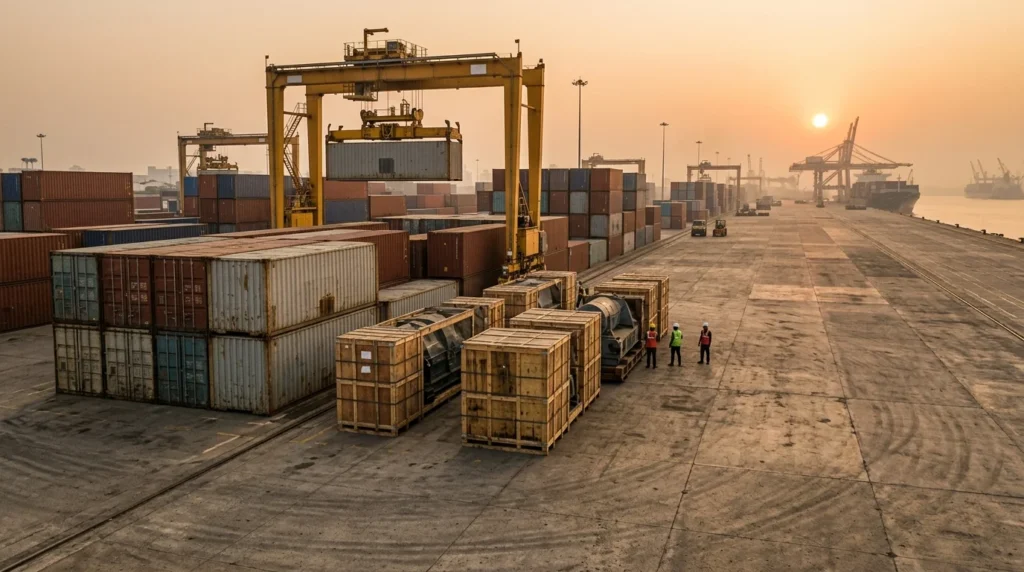
India to Australia: A Growing Lane
The India-Australia Economic Cooperation and Trade Agreement (ECTA), which entered force in December 2022, has accelerated trade flows between the two countries. Australian importers sourcing from India, primarily for pharmaceuticals, textiles and apparel, engineering goods, auto components, and gems and jewellery, are served by an improving direct service network.
Major origin ports: Nhava Sheva (Jawaharlal Nehru Port, near Mumbai), Chennai (Madras), and Mundra (Gujarat) are the primary container export ports. Services from Nhava Sheva to Sydney and Melbourne run 18–26 days; from Chennai, 16–22 days (slightly shorter due to more easterly position).
ECTA duty concessions: ECTA provides progressive tariff reductions on thousands of goods categories. Some goods qualify for immediate duty-free entry; others have scheduled reductions over 7–10 years. Confirm the ECTA rate for your specific HS codes with your customs broker. Not all goods benefit, and the rules of origin requirements must be met for the concession to apply.
Service frequency: Service frequency from India to Australia has improved since 2022 but remains less frequent than China-Australia. Most Australian ports receive 1–2 direct services per week from major Indian origins. This makes advance booking more important: if you miss your preferred vessel, the next departure may be 10–14 days away rather than 7 days.
USA to Australia
US-origin goods flowing into Australia cover electronics, machinery, agricultural products, chemicals, and pharmaceutical ingredients.
West Coast USA (Los Angeles / Long Beach, Seattle): The primary US export origin for Australia-bound goods. Transit times from LA/LB to Sydney: 17–22 days on direct services; 20–28 days via a transshipment at Auckland (NZ) or another Pacific hub. The Australia-US Free Trade Agreement (AUSFTA) provides duty-free entry for most US-origin goods meeting rules of origin. US exporters typically provide a certificate of origin or self-declared origin statement for AUSFTA claims. Note that AUSFTA rules of origin require substantial transformation in the US; goods manufactured in third countries and merely shipped through the US do not qualify.
East Coast USA (New York, Savannah, Houston): East Coast US exports to Australia route via Panama Canal or Suez Canal, with transit times of 25–40 days depending on routing. This is a less common lane, since most US exporters ship from the West Coast for Australia, but it is relevant for specific goods categories concentrated in the US Southeast and Gulf Coast (chemicals, forest products, agricultural commodities).
Route Selection Framework
Choosing the right route for a given import program involves five variables evaluated against each other. A sixth factor sits underneath all of them but rarely gets its own line in a route comparison: how long clearance actually takes at the destination port once the vessel arrives. A route that wins on ocean transit time can still lose on total door-to-warehouse time if the destination port has slower average clearance.
- Transit time requirement: What is the maximum acceptable transit time given your reorder point and safety stock? A business with 4 weeks of safety stock can tolerate a 25-day service; a business with 10 days of safety stock cannot absorb a 25-day service with ±7-day variability.
- Schedule reliability: How consistently does the service meet its schedule? A 16-day service running at 55% on-time reliability is worse for supply planning than a 19-day service running at 85% on-time. Much of that unreliability is not vessel-related at all: what actually delays containers at Australian ports is frequently a destination-side problem (congestion, equipment shortages, berth availability) that a faster origin service cannot fix.
- Freight cost: The per-CBM or per-TEU rate including all surcharges, destination handling, and local cartage. Compare total landed cost, not just ocean freight.
- Service frequency: How often does the vessel depart? Weekly departures give more flexibility than fortnightly; the consequence of a missed cut-off is a 7-day delay versus a 14-day delay.
- Destination port fit: Does the service call your preferred Australian port directly, or does it require transshipment or onward trucking?
No single service will be optimal on all five dimensions simultaneously. The trade-off most Australian importers face is between transit time and cost: faster, more reliable services often cost more. The right choice depends on your specific cost of stockout (lost sales, emergency airfreight cost, customer penalties) versus the freight premium for the faster service.
For a business where a stockout costs AUD 15,000 in lost margin per week and occurs once per year under the current service, switching to a faster, more reliable service that costs AUD 3,000 more per year in freight is a compelling trade even if the faster service saves only 3 days on average, because it reduces the variability that causes the stockout, not just the mean transit time.
A real route decision requires something a comparison table does not: naming the lanes you are not going to optimise for. “We ship from wherever is cheapest that week” is the absence of a strategy, because it never specifies which trade-off the business will accept. A route strategy names the lane it builds the supply chain around (say, direct Yantian-to-Sydney on a six-week safety-stock buffer) and names the lanes it will deliberately not chase rate advantages on, because the transit-time or reliability cost is not worth it for that product category. The second half is the one missing from most route-selection worksheets.
LCL vs FCL Route Considerations
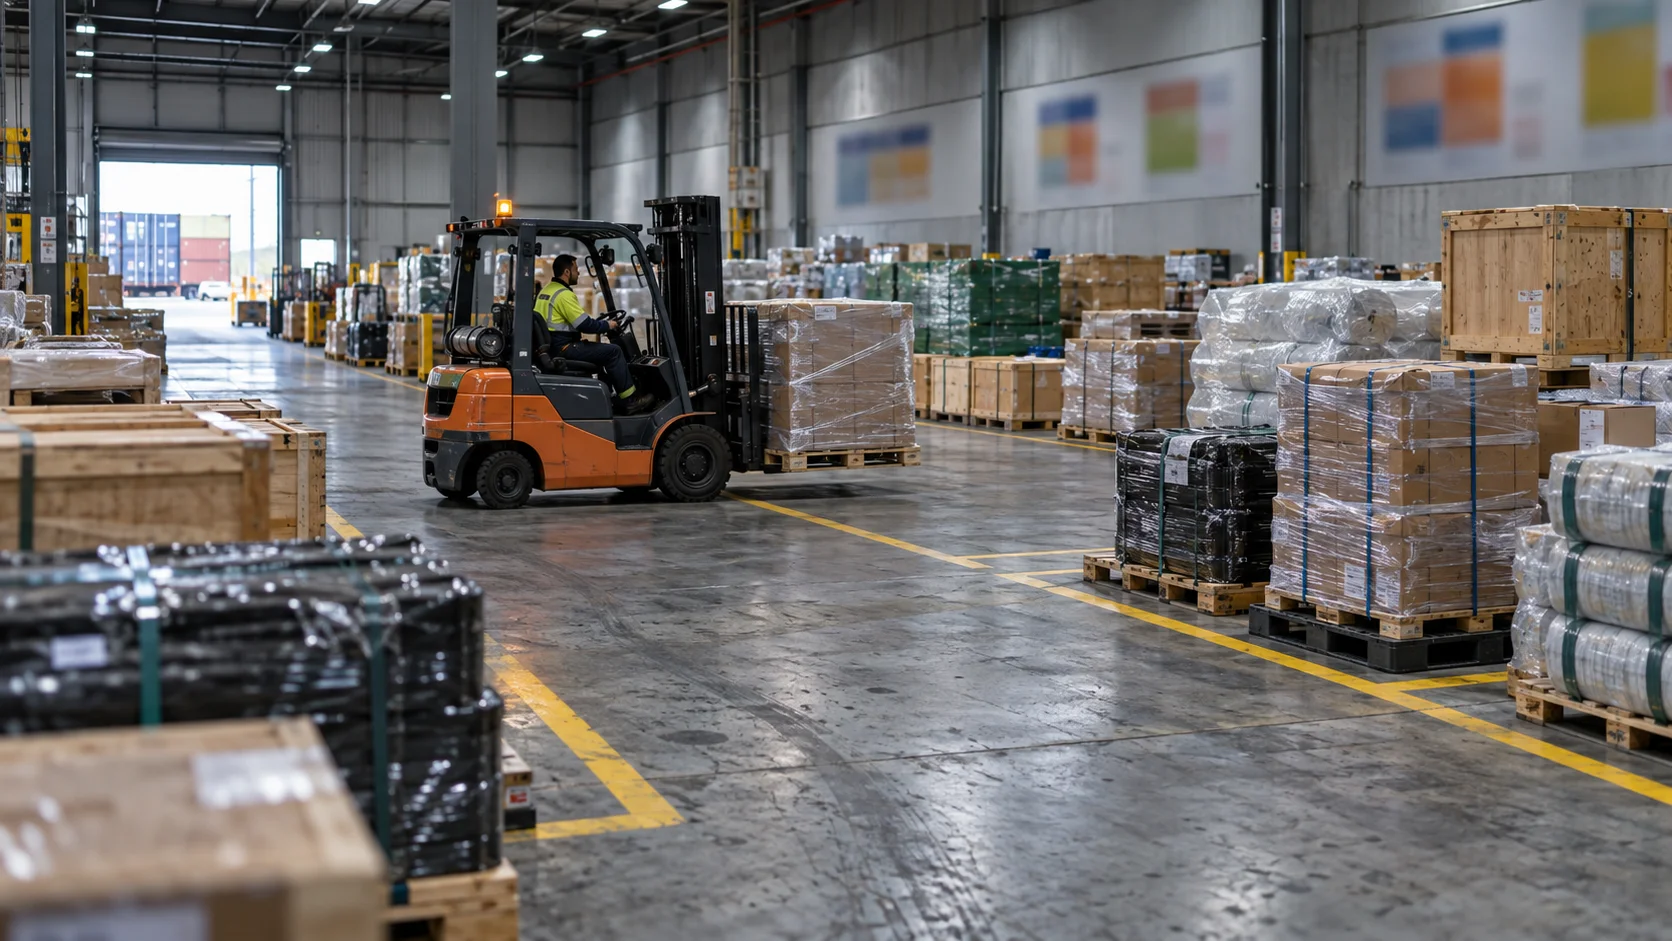
Route selection is not the same decision for LCL and FCL importers. FCL importers book their own dedicated container and can select from the full range of direct and transshipment services. LCL importers ship into a consolidator’s shared container and are dependent on which services the consolidator has booked, and cannot independently select a vessel service in the same way.
When evaluating LCL service options on a given lane, the relevant comparison is not between individual vessel services but between consolidating carriers: which LCL consolidator on the China-Australia lane offers the best combination of transit time, cut-off frequency, and rate? Major LCL consolidators typically have preferred carrier agreements with 1–3 shipping lines and offer weekly or fortnightly cut-offs depending on the volume of cargo they are moving on that lane. Asking your freight forwarder “which LCL consolidator do you use on this lane and what is their schedule reliability?” gives you more useful information than the vessel name.
For FCL importers, the route decision involves selecting both the shipping line and the specific service rotation within that line’s fleet. Two services from the same carrier may use different vessel rotations, one calling Singapore before Sydney and one direct, with different transit times and reliability records. Your freight forwarder should have access to schedule reliability data by vessel service and can recommend which services have consistent on-time records on your specific lane.
When to Review and Switch Routes
A route that was optimal 18 months ago may not be optimal today. Carrier alliances restructure their services periodically; new services launch; port infrastructure changes (new berths, new terminals); trade agreements alter duty economics; and freight rate differentials between competing routes shift. The following triggers should prompt a route review:
Your average transit time has increased by more than 5 days over the past 6 months without a corresponding change in your shipping origin. This indicates that your current service’s reliability has deteriorated. Perhaps the vessel rotation was lengthened, or port congestion at a transshipment hub has worsened. Compare alternative service options with your forwarder.
A new direct service has launched on your lane. Carrier alliances announce new service rotations periodically. A new direct service from your origin port to your destination port may offer faster transit than your current transshipment routing, at comparable or lower cost.
Your supplier base has shifted to a new region. If you originally sourced from Guangdong and have added suppliers in Zhejiang or Vietnam, the optimal consolidation depot and vessel service may have changed. A forwarder who was optimal for Guangdong cargo may not be optimal for a mixed Guangdong-Vietnam program.
Freight rate differentials between lanes have moved significantly. If the China-Australia lane has seen substantial rate increases while the Vietnam-Australia lane has stayed flat, and you source from both countries, consolidating more volume through Vietnam (if the goods qualify under AANZFTA and your suppliers can handle the volume) may reduce total freight cost, even if Vietnam is not the lower-cost manufacturing option for every SKU.
A new trade agreement has entered force. The India-Australia ECTA (December 2022) and any future agreements with other trading partners change the duty economics of alternative origin lanes. A route that previously attracted high duty may become cost-competitive after an FTA enters force.
Route reviews are worth conducting formally at least once per year, timed to coincide with the annual freight budget cycle, and immediately when any of the triggers above appear, since waiting for the annual review in an active market can mean 6–12 months of suboptimal freight cost. The review should cover all five variables in the selection framework above, using current rate quotes and the past 12 months’ schedule reliability data.
Swift Cargo sources freight on all major Australia import lanes (China, Southeast Asia, Europe, India, and the USA) and can model service options, rates, and reliability data for your specific origin-destination pairs. Visit swiftcargo.solutions/australia to discuss your import routes and identify where better service selection could improve your supply chain.
For how shipping frequency interacts with route selection, see How to Optimise Shipping Frequency for Your Import Business. For the freight cost variables that make up your total landed cost, see Total Landed Cost When Importing to Australia. For how seasonal demand affects rate levels on these lanes, see Seasonal Demand and Freight Pricing for Australian Importers.
Two importers using the same China-to-Australia lane, with comparable volumes and comparable budgets, can end up in very different positions after a few years, and the difference usually is not who found the cheaper carrier. One reviews its route choice on a fixed schedule, every six months, regardless of whether the current lane is causing any visible problem. The other only revisits the question after a bad shipment forces the issue, which means it is making the decision under pressure, with a deadline, instead of calmly with options open. The scheduled reviewer catches a rerouting opportunity or a new port option months before it becomes urgent. The reactive importer discovers the same opportunity only after paying for the problem it would have prevented. Neither company looks different from the outside until the difference compounds.
Related reading: for the full LCL vs FCL decision (crossover CBM, transit-time cost, fragility and security trade-offs), see our LCL vs FCL guide for Australian importers.
Related reading: Sydney vs Melbourne vs Brisbane: Port Choice for Inbound Cargo
Frequently Asked Questions
What is the fastest shipping route from China to Australia?
The fastest shipping routes from China to Australia are direct services (no transshipment) from Yantian, Nansha, Shanghai, or Ningbo to Sydney, Melbourne, Fremantle, or Brisbane. Direct port-to-port transit times on these services run 14–18 days. Services from northern China (Tianjin, Qingdao) to southern Australian ports typically run 16–22 days direct. Transshipment services routing via Singapore or Port Klang add 3–10 days depending on the connection window. The fastest service in the market at any given time depends on which shipping line alliance is running which rotation, so your freight forwarder can identify the fastest direct service on your specific port pair. Note that vessel schedule reliability (the percentage of vessels arriving within 24 hours of schedule) varies significantly between carriers and services; a nominally faster service with low reliability may deliver later than a slightly slower service with high on-time performance.
Is it faster to ship to Sydney or Melbourne from Asia?
Transit times from major Asian origin ports to Sydney (Port Botany) and Melbourne (Webb Dock or Swanston Dock) are broadly similar, typically within 1–3 days of each other on equivalent services. The difference is that some carrier strings call one port before the other, meaning the cargo arriving at the first-called port gets slightly earlier delivery. On most Asia-Australia services, Sydney is called before Melbourne (or vessels travel north to south down the east coast), giving Sydney a marginal transit time advantage. However, both ports have direct services from major Asian origins, and Melbourne has competitive direct services from China and Southeast Asia that match Sydney transit times. For importers distributing goods nationally, the more important variable is inland transport cost after port arrival, not the 1–2 day port-to-port transit difference.
How has the Red Sea situation affected shipping routes to Australia?
Since late 2023, the security situation in the Red Sea and Gulf of Aden has caused most container shipping lines to reroute Europe-Australia and Europe-Asia services via the Cape of Good Hope (southern tip of Africa) rather than through the Suez Canal. This adds approximately 10–14 days to transit times on Europe-Australia routes (from approximately 28–35 days Suez transit to 40–50 days Cape of Good Hope transit) and effectively removes 15–20% of vessel capacity from the Europe-Australia lane because the same ships must sail longer distances per rotation. The result has been higher freight rates, longer and more variable transit times, and less frequent service schedules on Europe-Australia. A partial return to Suez began in early 2026, but transit volumes remain far below pre-crisis levels and most Europe-Australia services still route via the Cape. Asia-Australia routes (from China, Southeast Asia) are not directly affected by the Red Sea situation since they do not transit the Red Sea. However, some vessels that previously served both Asia-Australia and Europe-Australia rotations have been reallocated, slightly reducing Asia-Australia capacity.
What are the main Australian ports for container imports?
Australia’s five main container import ports are: Port Botany (Sydney), handling approximately 2.5 million TEUs annually, with the most frequent and competitive direct services from all major origins; Port of Melbourne (Webb Dock and Swanston Dock), Australia’s largest container port, approximately 3.1 million TEUs per year, with strong direct services from China and Southeast Asia and improving India connections; Port of Brisbane, serving Queensland and northern NSW, approximately 1.1 million TEUs, with direct Asia services; Fremantle (Perth), the main port for Western Australia, approximately 850,000 TEUs, important for imports destined for WA, SA, and the mining sector; Adelaide (Port Osborne), approximately 400,000 TEUs, serves South Australia. Port selection for importers is primarily driven by the location of their distribution centre or warehouse, not by port availability. Goods imported into Sydney must then be trucked to Melbourne if the customer is in Victoria, adding cost and transit time.